Week 1:
Discussed the basic components of the project. The group decided that the four main
components to this project are communication, graphing, coding and data analyzation,
and controls. We will start off with using a 3D printed base, an Arduino Uno, ultrasonic
sensors, and two XBee's as the basic components.
components to this project are communication, graphing, coding and data analyzation,
and controls. We will start off with using a 3D printed base, an Arduino Uno, ultrasonic
sensors, and two XBee's as the basic components.
----------------------------------------------------------------------------------------------------------------------------------
Week 2:
Discussed about using an XBee for communication from the Arduino Uno to a computer. A
software called ROS could be used to perform the graphs to display what the sensors have
detected. An example can be seen in Figure 1 below.
software called ROS could be used to perform the graphs to display what the sensors have
detected. An example can be seen in Figure 1 below.

Figure 1. Example of an ROS map.
----------------------------------------------------------------------------------------------------------------------------------


----------------------------------------------------------------------------------------------------------------------------------
Week 5:
An encoder was made for localizing the robot as seen in Figure 6. An HC-020K
photoelectric encoder will be used to count the ticks from the encoder. This encoder was
made to have only two different states per revolution to make processing the current
location easier and less computationally intensive. The part shown below will be 3D printed using a MakerBot.

----------------------------------------------------------------------------------------------------------------------------------
Week 6:
All components have been put together and function. Values calculated with the ultrasonic
sensor can be successfully processed and sent over the XBee to another XBee which
communicates serially with MatLab. The test rig can be seen in Figure 7.

In order to localize the direction that the mobile robot is facing, a control systems would
need to be created, or a compass could be used. The HMC6352 Compass Module might
be used in order to accomplish this task. A control algorithm will also have to made in
order to attempt to move the robot straight. For the first step, the mobile robot will move
forward five rotations, the servo will sweep the ultrasonic sensor, the location of the robot
will be added to any object detected by the ultrasonic sensor, and all this information will
be sent through the XBee.
----------------------------------------------------------------------------------------------------------------------------------
Week 7:
In order to minimize space, the circuitry done on the breadboard was soldered onto a
prototype board. On this board, the L293D motor driver and a quad-NAND gate was
placed. The L293D motor driver contains a quad h-bridge allowing for two motors to be run
on the one IC. The two PWM pins were lazy chained together and router to the other side
of the board along with the four input and output pins. The NAND gate was used in order to
connect the three digital sensors together into one connection to the Arduino. The digital
sensors gave a high voltage if there was not an object within 10 cm from the sensor, and a
low voltage if there was an object within 10 cm. If the wires were to all be connected
together into one input, without the use of a NAND gate, all the sensors would have to
detect an object in order for there to be a low voltage going into the Arduino. Using the
quad-NAND gate IC, De Morgan's law was used with the NAND gate in to give a high
voltage if any one sensor saw an object, and give a low voltage if all of the sensor did not
detect any object. The prototype board can be seen in Figure 8.
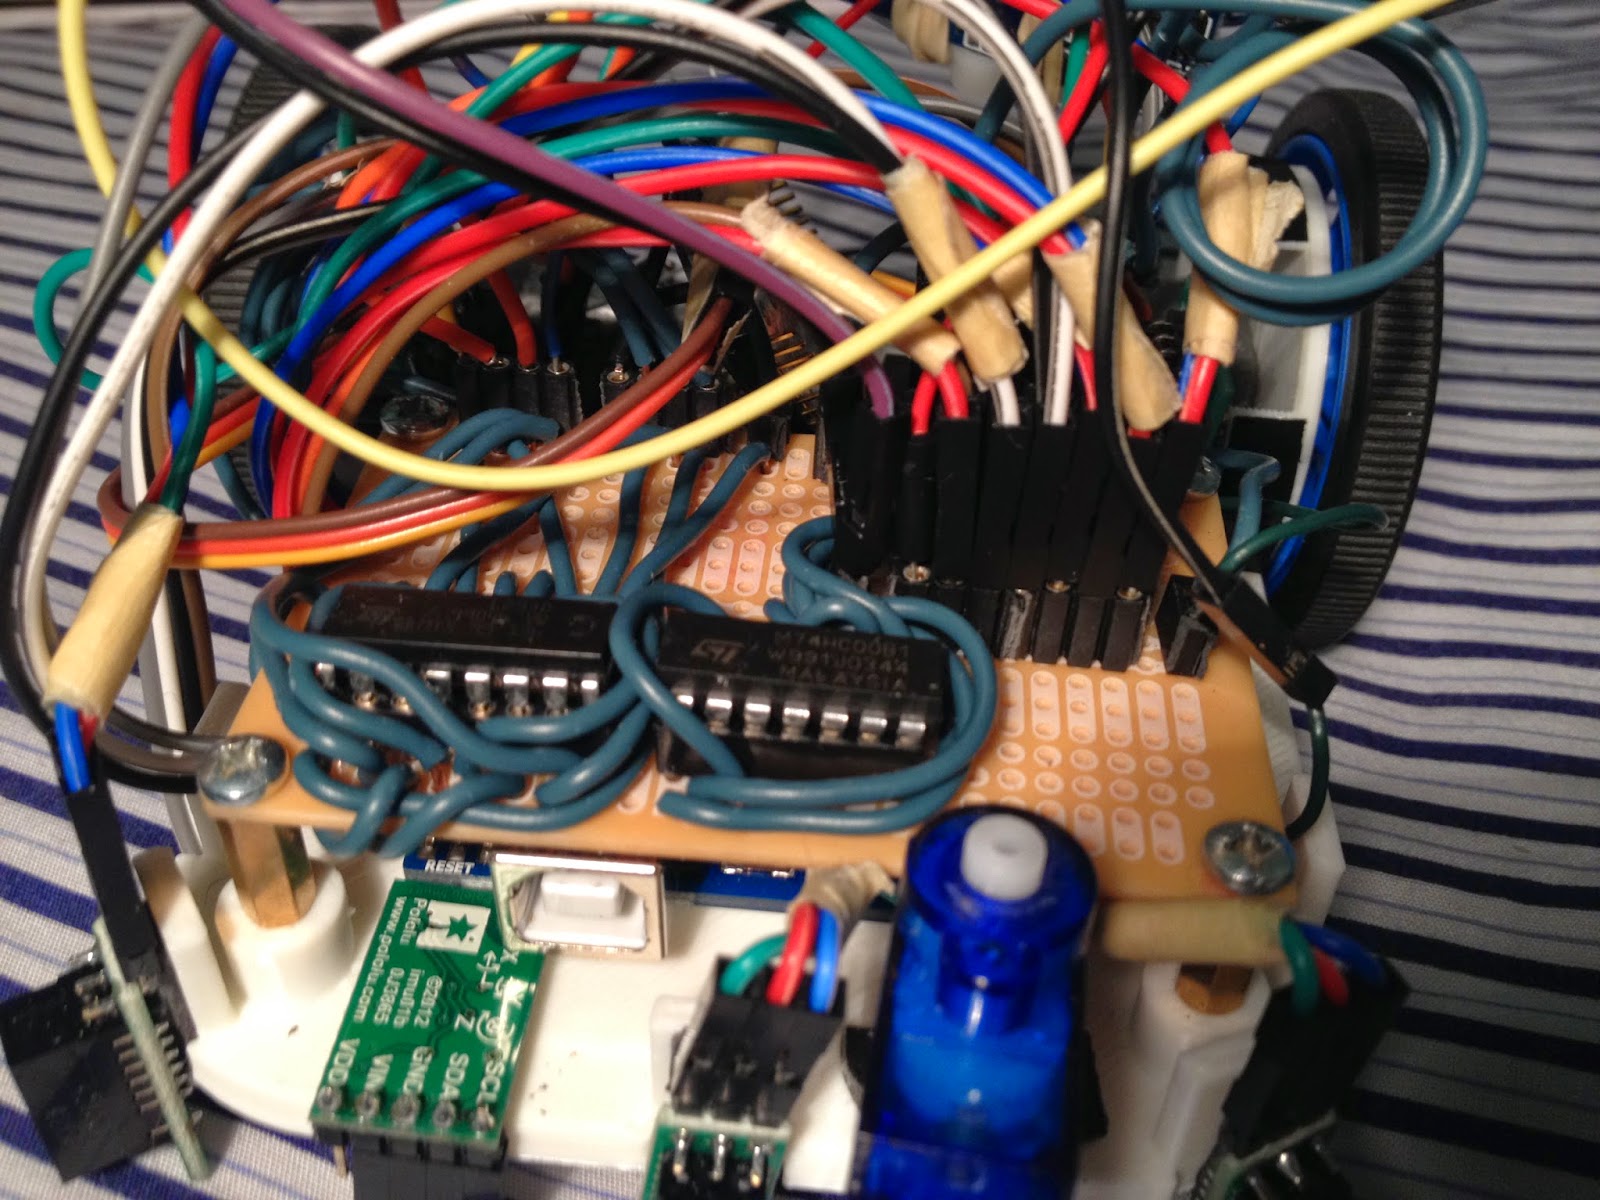 Figure 8. Prototype board containing the L293D motor driver and quad-NAND gate.
----------------------------------------------------------------------------------------------------------------------------------
Week 8:
The final design for the base has been made and 3D printed using a MarkerBot. The base
can be seen in Figure 9. This base allowed for the prototype board, motors, photoelectric
encoder, wheels, Arduino, digital sensors, servo, ultrasonic sensor, compass, xbee, and
battery pack to all fit onto the 11 cm by 9 cm base. The 3D printed encoder was
also redesigned to have four ticks per revolution to allow for more accuracy, while still not
being computationally intensive.
 Figure 9. Final 3D printed base containing all components.
When testing the robot, all systems worked and data was able to be plotted on the first
test. The first test consisted of having the robot elevated on the platform in order to make
sure the mobile robot is not moving. The Matlab code was made to determine the current
location of the robot using (x,y) coordinates and displaying these points on the graph. The
mobile was turned by hand in order to mimic the way the robot would move on the ground.
The data was successfully plotted as seen in Figure 10.
 Figure 10. Data displaying the (x,y) location of the mobile robot in two dimensional space.
----------------------------------------------------------------------------------------------------------------------------------
Week 9 & 10:
When testing out the functionality of the mobile robot all the components, initial tests
proved to work. After some time, the Xbee’s encountered some hindrance and ultimately
failed to be able to communicate information. The Xbee’s would be able to detect that
they were on the same networks, but would not communicate. This could have been due
to a bad connection, a change in the configuration, or a problem with the Arduino code. In
order to ensure that this problem was not due to a bad connection, the connection to the
Xbee was wire wrapped. After testing the Xbee again, they were still not able to
communicate. The configurations were checked using the XCTU software along with the
Arduino code to make sure the proper procedures were done correctly in order to send
data. After checking these, the Xbee’s would still not communicate. Due to this problem,
the robot was not fully functional and was not able to be optimized. The preliminary testing
for mapping and localization did prove to work, but there is still work to be done in respect
to finalizing the system integration.
----------------------------------------------------------------------------------------------------------------------------------
Future Work:
Ultimately, the purpose of this project was to create a fully functional two-dimensional
autonomous mapping robot that would be useful for educational purposes. Final testing
and optimization still needs to be performed in order to show that this can be fully
functional. After this, a kit can be made to allow for customizable components and
projects that the user desires. This product will be marketed for all ages ranging from
middle and high school students, up to college students. This kit only costs $279.85
compared to other robotics kits like Lego NXT and the Blackfin Surveyor Robot, which
range around $530 to $560. While being at half the cost when compared to other robotics
kit, this kit is customizable and can be used for real world applications. This will give the
opportunity for students to become engaged with robotics, enabling them to learn and take
on more difficult concepts in order to solve complex problems.
----------------------------------------------------------------------------------------------------------------------------------
Week 3:
Began to code the Arduino to send serial commands to MatLab in order to analyze and
plot the data. A data plot sample can be seen in Figure 2 which shows a set of data that
has been detected and plotted without any filtering. This is done by having the Arduino
print serial commands to the computer, which will then be read by a serial object created
in MatLab. All of the math has been done on the Arduino, which determined the X and Y
coordinates of the surfaces detected by the ultrasonic sensor. This information is printed
serially with a tag as the first digit which corresponds to the X or Y value of a detected
object. The information is sent in ASCII for each piece of data sent, and must be
converted. After the conversion, points are created and then updates onto the plot after
reading values twenty-five serial readings. The test rig can be seen in Figure 3.
Note: All the codes are posted onto the documentation portion of this blog.
Figure 2. Plotted points from the ultrasonic sensor.
Figure 3. Test Rig.
Changes that have been made:
The group decided to try to use the ROS software described earlier in order to plot the
data. The software has been used before with projects that are similar to ours. After
downloading the software, the group realized that Linux terminal commands would need
to be used to create the environment and to plot points. Because of this, the group
decided to use MatLab instead since the members are familiar with this software.
Plans for next week:
The plan for next week is to put the ultrasonic onto a mobile robot and attempt to read both
the robots location and any objects detected by the ultrasonic sensor. Problems that may
occur are latency, processor speeds, and serial communication speeds. Research will be
conducted on STP and optimization of signal processing. A chassis for the mobile robot
has already been made and can be seen in Figure 4.
Note: Documentation on the chassis can be seen here on the main website under models.
Figure 4. Mobile robot 3D printed chassis.
----------------------------------------------------------------------------------------------------------------------------------
Week 4:
A GUI was made in MatLab in order to display 3 plots: unfiltered data, filtered data, and a
grayscale image of the data in order to see the probability of a wall being in an area based
on how many times a wall has been detected in that location. This GUI can be seen in the Figure 5.
Plans for next week:
An encoder will be made in order to localize the mobile robot through a room. This part will
be designed in CREO Parametric and will be 3D printed by a MakerBot.
Along with the encoder, an algorithm will have to made in order to let the mobile robot
know not to move to a location that it has already been to. This could be done by making
landmarks of areas of high concentration of points which would correlate to the mobile
robot being sure that there is an enclosed will at that location. The mobile robot will then
stay as far away from this landmark as it attempts to maneuver and map the rest of the
room until all areas have been marked with these landmark. This concept will be
integrated into code once the mobile robot is moving and working.
Figure 5. MatLab GUI for graphs of unfiltered data, filtered data, and grayscale image of the plot.
----------------------------------------------------------------------------------------------------------------------------------
Week 5:
An encoder was made for localizing the robot as seen in Figure 6. An HC-020K
photoelectric encoder will be used to count the ticks from the encoder. This encoder was
made to have only two different states per revolution to make processing the current
location easier and less computationally intensive. The part shown below will be 3D printed using a MakerBot.
Figure 6. Motor encoder with one tick per revolution.
Plans for next week:
All the components will be put together and a basic code for localization and object
detection will be put together on Arduino IDE. The Xbee's will also be configured in order to
send information from the Arduino to another XBee which is connected to a computer for
data analyzation and graphing.
----------------------------------------------------------------------------------------------------------------------------------
Week 6:
All components have been put together and function. Values calculated with the ultrasonic
sensor can be successfully processed and sent over the XBee to another XBee which
communicates serially with MatLab. The test rig can be seen in Figure 7.
Figure 7. In Red: Xbee, Green: Ultrasonic sensor mounted onto a micro servo, Pink: 3D printed encoder
Light Blue: Photoelectric encoder, Yellow: L293D Motor Driver, Dark Blue: Arduino.
In order to localize the direction that the mobile robot is facing, a control systems would
need to be created, or a compass could be used. The HMC6352 Compass Module might
be used in order to accomplish this task. A control algorithm will also have to made in
order to attempt to move the robot straight. For the first step, the mobile robot will move
forward five rotations, the servo will sweep the ultrasonic sensor, the location of the robot
will be added to any object detected by the ultrasonic sensor, and all this information will
be sent through the XBee.
----------------------------------------------------------------------------------------------------------------------------------
Week 7:
In order to minimize space, the circuitry done on the breadboard was soldered onto a
prototype board. On this board, the L293D motor driver and a quad-NAND gate was
placed. The L293D motor driver contains a quad h-bridge allowing for two motors to be run
on the one IC. The two PWM pins were lazy chained together and router to the other side
of the board along with the four input and output pins. The NAND gate was used in order to
connect the three digital sensors together into one connection to the Arduino. The digital
sensors gave a high voltage if there was not an object within 10 cm from the sensor, and a
low voltage if there was an object within 10 cm. If the wires were to all be connected
together into one input, without the use of a NAND gate, all the sensors would have to
detect an object in order for there to be a low voltage going into the Arduino. Using the
quad-NAND gate IC, De Morgan's law was used with the NAND gate in to give a high
voltage if any one sensor saw an object, and give a low voltage if all of the sensor did not
detect any object. The prototype board can be seen in Figure 8.
----------------------------------------------------------------------------------------------------------------------------------
Week 8:
The final design for the base has been made and 3D printed using a MarkerBot. The base
can be seen in Figure 9. This base allowed for the prototype board, motors, photoelectric
encoder, wheels, Arduino, digital sensors, servo, ultrasonic sensor, compass, xbee, and
battery pack to all fit onto the 11 cm by 9 cm base. The 3D printed encoder was
also redesigned to have four ticks per revolution to allow for more accuracy, while still not
being computationally intensive.
When testing the robot, all systems worked and data was able to be plotted on the first
test. The first test consisted of having the robot elevated on the platform in order to make
sure the mobile robot is not moving. The Matlab code was made to determine the current
location of the robot using (x,y) coordinates and displaying these points on the graph. The
mobile was turned by hand in order to mimic the way the robot would move on the ground.
The data was successfully plotted as seen in Figure 10.
----------------------------------------------------------------------------------------------------------------------------------
Week 9 & 10:
When testing out the functionality of the mobile robot all the components, initial tests
proved to work. After some time, the Xbee’s encountered some hindrance and ultimately
failed to be able to communicate information. The Xbee’s would be able to detect that
they were on the same networks, but would not communicate. This could have been due
to a bad connection, a change in the configuration, or a problem with the Arduino code. In
order to ensure that this problem was not due to a bad connection, the connection to the
Xbee was wire wrapped. After testing the Xbee again, they were still not able to
communicate. The configurations were checked using the XCTU software along with the
Arduino code to make sure the proper procedures were done correctly in order to send
data. After checking these, the Xbee’s would still not communicate. Due to this problem,
the robot was not fully functional and was not able to be optimized. The preliminary testing
for mapping and localization did prove to work, but there is still work to be done in respect
to finalizing the system integration.
----------------------------------------------------------------------------------------------------------------------------------
Future Work:
Ultimately, the purpose of this project was to create a fully functional two-dimensional
autonomous mapping robot that would be useful for educational purposes. Final testing
and optimization still needs to be performed in order to show that this can be fully
functional. After this, a kit can be made to allow for customizable components and
projects that the user desires. This product will be marketed for all ages ranging from
middle and high school students, up to college students. This kit only costs $279.85
compared to other robotics kits like Lego NXT and the Blackfin Surveyor Robot, which
range around $530 to $560. While being at half the cost when compared to other robotics
kit, this kit is customizable and can be used for real world applications. This will give the
opportunity for students to become engaged with robotics, enabling them to learn and take
on more difficult concepts in order to solve complex problems.
No comments:
Post a Comment